Production AI Monitoring for Q2: Catching Silent Failures, Cost Overruns, and Quality Drift Before They Compound
You shipped the pilot. The demo worked. The stakeholders approved it in Q1, and now it's Q2 and the workflow is live in production. Congratulations. Now the real work starts. Here's what nobody tells…
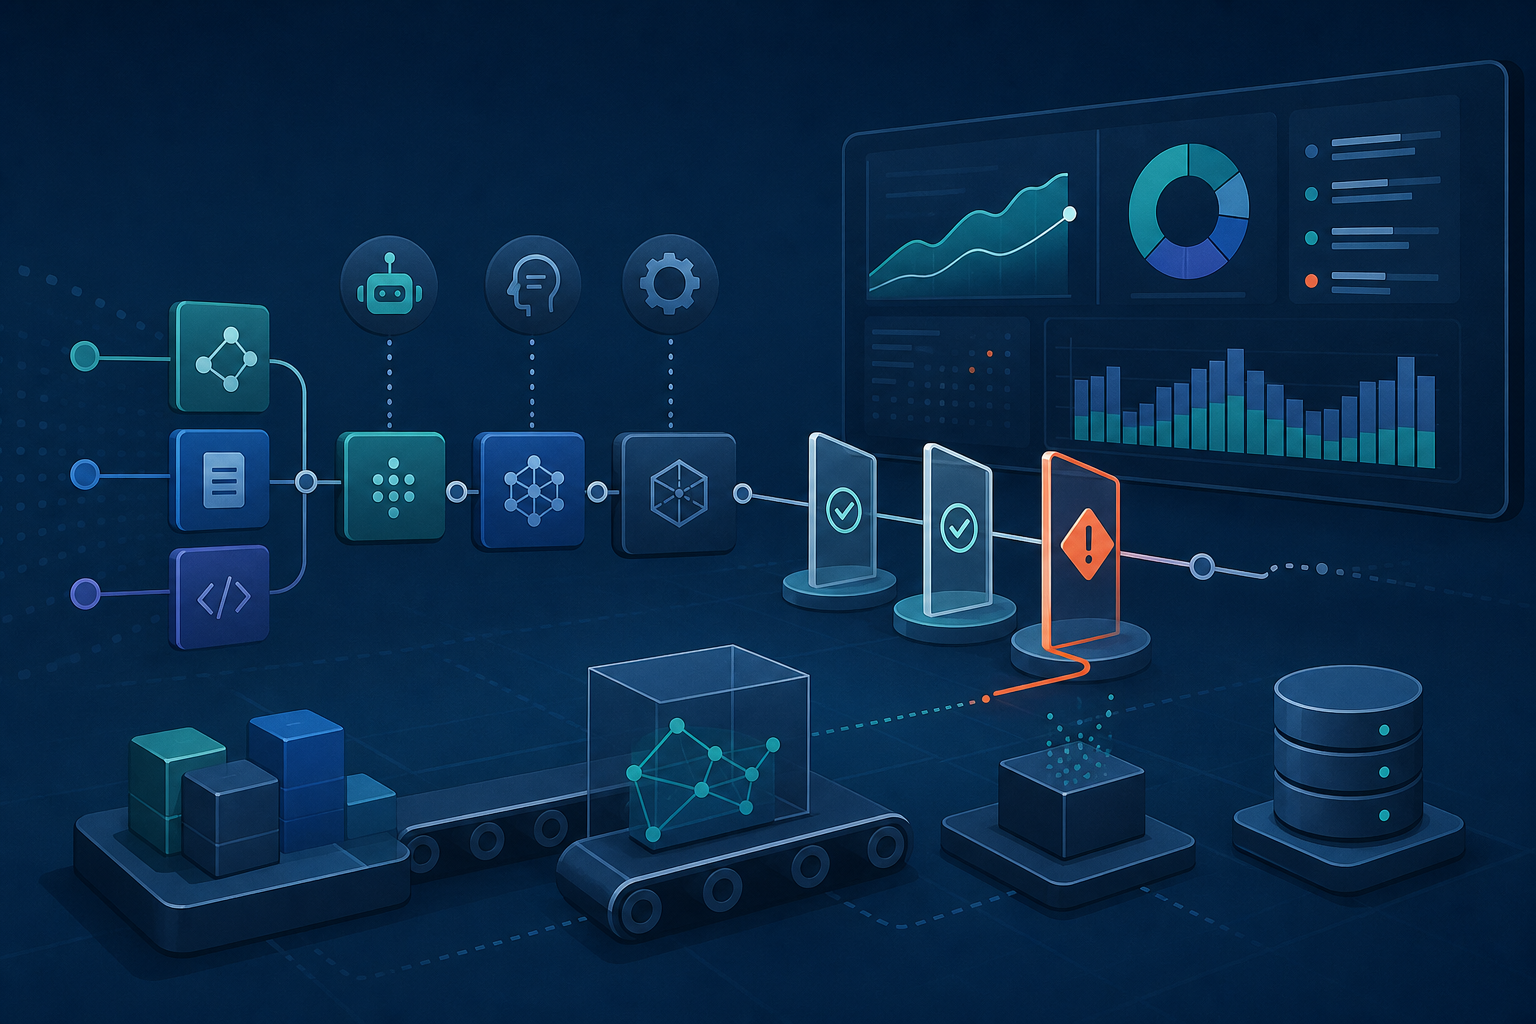
You shipped the pilot. The demo worked. The stakeholders approved it in Q1, and now it's Q2 and the workflow is live in production.
Congratulations. Now the real work starts.
Here's what nobody tells you after the demo: AI workflows don't fail the way traditional software fails. There's no stack trace. No 500 error lighting up your alerting dashboard. No obvious moment where something broke. Instead, your AI workflow just quietly gets worse — and if you're not instrumented to catch it, you'll find out the hard way. A customer complains. An analyst notices the outputs stopped making sense three weeks ago. Your infrastructure bill comes in 40% higher than projected.
This post is for the teams shipping Q2 pilots into production right now. We're going to walk through exactly how to monitor production AI workflows — what metrics actually matter, how to design alert thresholds that trigger on real problems, how to roll back without panic, and how to document all of it in a way that satisfies your security and compliance teams. No MLOps department required.
The Silent Failure Problem
Traditional software has a relatively binary failure mode: it works or it throws an error. AI workflows have a third mode — they continue running, returning responses, logging successful completions, and billing you for tokens while producing outputs that are subtly or catastrophically wrong.
Call it quality drift. Call it silent degradation. Whatever you call it, it's the failure mode that bites Q2 teams the hardest because you're moving fast, you're focused on the next feature, and the monitoring you set up during the pilot was good enough to get you to launch — not good enough to keep you honest in production.
Here's what silent failure looks like in practice:
Scenario 1: Retrieval degradation. Your RAG pipeline was returning highly relevant chunks in testing because your test queries matched your indexed content well. In production, users ask questions your index doesn't cover cleanly. Retrieval hit rate drops from 87% to 61%. The LLM, lacking good context, starts hallucinating plausible-sounding answers. No errors. Just wrong outputs delivered confidently.
Scenario 2: Prompt drift. Someone on the team tweaked the system prompt two weeks ago — a minor adjustment to tone. The change interacted badly with a specific input pattern that shows up in 8% of real user requests. For those users, the output structure broke and downstream parsing started silently swallowing the malformed responses. Your success metrics still look green because 92% of runs are fine.
Scenario 3: Cost overrun. Your expected token cost per workflow run was $0.04. A new user behavior pattern — longer inputs, more follow-up turns — is pushing average run cost to $0.11. You don't notice for three weeks. Then you get the bill.
All three scenarios share the same root cause: insufficient instrumentation at launch. Let's fix that.
The Metrics That Actually Matter
Before we talk about what to measure, let's clear something up. A dashboard showing you "AI requests processed today" and "average response time" is not a monitoring strategy. Those are vanity numbers. They tell you the system is running. They don't tell you whether it's working.
Here are the operational signals that matter — and what they're actually telling you.
1. Latency P95 (not average)
Average latency hides the outliers that are ruining your user experience. Track P95 — the latency at the 95th percentile of your requests. If your P95 is climbing while your average stays flat, you have a tail latency problem that's hitting a subset of users hard.
Instrument it: Log start and end timestamps for every workflow run. Aggregate in whatever observability tool you're already using (Datadog, Grafana, CloudWatch — doesn't matter). Set your baseline in the first week of production, then alert on meaningful deviation from that baseline, not an arbitrary absolute threshold.
Concrete threshold to start with: Alert if P95 latency increases more than 40% from your 7-day rolling baseline.
2. Token Cost Per Workflow Run
This is your unit economics signal. If you know a workflow should cost roughly $0.04–$0.06 per run and it starts trending toward $0.10, something changed — input length, conversation depth, retry loops, or model selection. Find it before the bill does.
Instrument it: Log prompt token count, completion token count, and model ID for every LLM call. Calculate cost at log time using current pricing. Roll up to cost-per-workflow-run. This is 20 lines of logging code.
Concrete threshold to start with: Warning at 1.5x your baseline cost-per-run. Critical at 2.5x. Auto-pause at 3x (more on auto-pause logic below).
3. Retrieval Hit Rate (RAG workflows only)
If you're using retrieval-augmented generation, you need to know whether your retrieval step is actually finding relevant content. A naive approach is to log retrieval similarity scores and track the percentage of queries returning at least one chunk above your relevance threshold.
Instrument it: Log the top similarity score for every retrieval call. Define a "hit" as any retrieval returning at least one chunk above your threshold (e.g., cosine similarity > 0.75, or whatever your baseline established). Track hit rate as a rolling percentage.
Concrete threshold to start with: Warning if 7-day rolling hit rate drops more than 10 percentage points from baseline. Critical if it drops more than 20 points.
4. Ground Truth Eval Scores
This is the hardest one to instrument and the most important one to have. You need a mechanism to evaluate output quality against known-good examples — not just whether the system returned a response, but whether the response was correct.
For most teams, this means maintaining a set of 50–200 golden test cases: inputs with known expected outputs or known expected qualities (completeness, tone, format, factual accuracy). Run your eval harness against these on a scheduled basis — daily for high-stakes workflows, weekly for lower-stakes ones. Track the pass rate over time.
Instrument it: Define your eval criteria in code. Run evals on a schedule. Log pass/fail per test case and aggregate to a score. Tools like LangSmith, PromptFoo, or a simple script calling your eval LLM work fine. The tool matters less than the habit.
Concrete threshold to start with: Warning if your eval score drops more than 5 percentage points from your launch baseline. Critical at 10 points.
5. Security-Relevant Signals
This one gets skipped most often and regretted most painfully. You need to be logging and monitoring for:
- Prompt injection patterns — inputs that contain instruction-override language ("ignore previous instructions," "you are now," "system:") or attempts to exfiltrate system prompt content.
- Unexpected data boundary crossings — if your workflow is scoped to operate on Company A's data, you want an alert if it's being invoked in a context that could expose Company B's data.
- Abnormal output length or structure — a response that's 10x longer than typical or that contains structured data in unexpected formats can signal jailbreak success or retrieval system compromise.
Instrument it: Run a lightweight classifier or regex check over inputs before they hit the LLM. Log flagged inputs. Alert immediately on anything that matches known injection patterns. This is not a significant computational cost, and it's a load-bearing part of your security posture — not a nice-to-have.
Alert Threshold Design: A Three-Tier Model
Not every anomaly needs to wake someone up at 2 AM. Here's a practical three-tier alert model you can implement without a dedicated MLOps team.
Tier 1: Informational (Log and Monitor)
These are signals worth tracking but not worth interrupting anyone's workflow over. They go into your observability dashboard, they inform your weekly review, and they give you trend data to act on proactively.
- Cost-per-run creeping up 10–25% from baseline
- P95 latency increasing 10–20% from baseline
- Retrieval hit rate dropping 5–10 percentage points
- Low-confidence flagged inputs (possible but not definitive injection patterns)
Response: Automatic logging. Include in weekly team review.
Tier 2: Warning (Async Human Review)
These are signals that require a human to look at them within a few hours — not immediately, but not next week either. Route these to a Slack channel where someone has responsibility to respond within a defined SLA (e.g., 4 business hours).
- Cost-per-run at 1.5–2.5x baseline
- P95 latency increasing 40%+ from baseline
- Retrieval hit rate dropping 10–20 percentage points
- Eval score dropping 5–10 percentage points
- 3+ prompt injection attempts in a rolling 1-hour window from the same origin
Response: Slack alert to AI-ops channel. Assigned owner reviews within 4 hours. Documents findings and action taken.
Tier 3: Critical (Auto-Pause + Page On-Call)
These are conditions where the workflow should stop — or at minimum, stop processing new requests — until a human makes an explicit decision to resume. The cost of a false positive here (brief downtime) is lower than the cost of letting a bad state continue compounding.
- Cost-per-run at 3x+ baseline (budget protection)
- Eval score dropping 10+ percentage points (quality protection)
- Confirmed prompt injection success (security incident)
- Unexpected data boundary crossing detected (security incident)
- Retrieval system returning zero results for 15+ consecutive queries (infrastructure failure)
Response: Auto-pause new workflow executions. Page on-call engineer immediately. Require explicit human decision to resume. Log the decision and rationale.
A quick note on auto-pause implementation: you don't need sophisticated infrastructure for this. A feature flag that your monitoring system can flip — checked at the start of every workflow run — is sufficient for most teams. When the flag is off, requests return a graceful degradation response. Simple, auditable, effective.
Rollback Procedures That Actually Work
Every team says they have a rollback plan. Most teams have a vague intention to roll back and no defined procedure for doing it under pressure.
Here's what a real rollback capability requires:
Version Your Prompts and Retrieval Configs Like Code
If your system prompt lives in a config file that gets deployed with your application, you can roll it back the same way you'd roll back any other code change. If it lives in a database field someone edits through an admin UI, you're one bad edit away from a silent failure with no easy recovery path.
Treat prompts as code. Version control them. Review changes before they go to production. Tag the version in every log entry so you can correlate output quality changes with prompt changes.
Same goes for your retrieval configuration — chunk size, overlap, embedding model, similarity threshold. These are parameters that affect output quality, and they should be versioned and logged.
Define Your Minimum Viable Rollback State Before You Ship
Before your Q2 workflow goes live, document: what version of the system prompt is your fallback? What retrieval configuration? What model? This is your "known good" state. If things go wrong and you need to act fast, you should be able to answer "roll back to the v1.2 system prompt and the June 3 retrieval index" without a 20-minute Slack thread trying to figure out what state to restore to.
Write it down. Put it in your runbook. Link it from your alerting documentation.
Establish Decision Criteria, Not Just Mechanics
The rollback mechanics are the easy part. The hard part is knowing when to pull the trigger versus letting the system self-correct.
Here's a simple decision framework:
Self-correct (don't roll back) when:
- The anomaly is in Tier 1 or early Tier 2
- You've identified a plausible transient cause (a spike in unusual inputs, a temporary retrieval service degradation that has since recovered)
- Your eval scores are declining but still above your minimum acceptable threshold
- The downstream impact is minor and reversible
Rollback when:
- A Tier 3 alert has triggered and the root cause isn't immediately identifiable
- Eval scores have dropped below your minimum acceptable threshold and the trend is continuing
- A security-relevant signal has been confirmed (don't wait — roll back immediately and investigate)
- You've been in Tier 2 for more than 24 hours without a clear remediation path
Document these criteria. The engineer on call at 11 PM shouldn't be making judgment calls from scratch. They should have a decision tree that tells them what to do.
Governance Tie-In for Enterprise Teams
If you're a CTO, CISO, or VP of Engineering at a company with compliance obligations, everything above isn't just operational hygiene — it's audit evidence. Here's how to frame it.
NIST AI RMF: RESPOND and RECOVER Functions
The NIST AI Risk Management Framework's RESPOND function requires that organizations have documented processes for responding to AI incidents, including anomalies in AI system behavior. Your three-tier alert model, your Tier 3 auto-pause logic, and your rollback decision criteria directly satisfy this requirement.
The RECOVER function requires that you can restore normal operations after an incident and document what happened. Your versioned prompts and retrieval configs, your rollback state documentation, and your post-incident logging cover this.
A monitoring and alerting runbook isn't a compliance document bolted on after the fact. It is the compliance evidence, as long as you write it before the incident rather than reconstructing it after.
OWASP LLM Top 10 Controls
Your security-relevant monitoring signals map directly to OWASP LLM Top 10 controls:
- LLM01: Prompt Injection — your input classifier and injection pattern monitoring are your primary detection controls. Logging flagged inputs with timestamps and origins is your evidence of control operation.
- LLM06: Sensitive Information Disclosure — your data boundary crossing detection is your monitoring control. Document what the boundary is, how you detect crossings, and what the alert/response process is.
- LLM09: Overreliance — your eval harness and ground truth scoring are your quality assurance controls. Declining eval scores are a leading indicator of the kind of output degradation that causes overreliance failures downstream.
If you're going through a SOC 2 audit, an enterprise security review, or any AI-specific compliance assessment, a documented monitoring runbook with defined thresholds, alert owners, response SLAs, and rollback procedures is exactly what your auditors want to see. Start building it now, before the audit is scheduled.
Putting It Together: Your First Production Monitoring Stack
You don't need a dedicated MLOps team to implement this. Here's what a lean team can ship in a week:
Day 1–2: Add structured logging to every LLM call. Log: timestamp, model, prompt tokens, completion tokens, calculated cost, latency, workflow version, retrieval hit/miss (if applicable). Pipe logs to whatever observability tool you already have.
Day 3: Set up your golden eval set. Take 50 real production inputs from your first week (anonymized as needed), label expected outputs or quality criteria, write a script to run them against your current workflow, and log the aggregate score. This is your baseline.
Day 4: Define your alert thresholds. Use the tiers above as a starting point. Adjust based on your workflow's risk profile. Write them down.
Day 5: Set up Tier 2 Slack alerts and Tier 3 auto-pause. Test both in a staging environment. Confirm the alerts fire when they should and don't fire when they shouldn't.
Day 6–7: Write your rollback runbook. Document your minimum viable rollback state, your decision criteria, and your post-incident logging requirements. Get it reviewed by whoever will be on call.
That's a week of focused work. It's not glamorous. It's not a feature your users will ever see. But it's the difference between a Q2 pilot that becomes a reliable production asset and one that quietly degrades into a customer incident.
The Bottom Line
AI workflows in production require a different monitoring mindset than traditional software. The failure modes are quieter, the signals are subtler, and the compounding effects of ignoring them are worse — because by the time a silent failure becomes visible, it's been degrading for weeks.
The teams that build durable AI products in 2025 aren't the ones with the most sophisticated models. They're the ones who treat monitoring, evaluation, and rollback as first-class engineering work — not an afterthought you get to after the launch checklist is done.
If you're shipping a Q2 pilot into production right now, this week is the right week to build your monitoring foundation. Not next sprint. Not after you see the first problem. Now.
Download the Horizon Two Labs Production AI Monitoring Checklist — a one-page runbook template covering the metric tiers, alert thresholds, and rollback decision tree from this post. Drop it directly into your Q2 workflow and have a production-ready monitoring foundation before your next sprint review.
[Download the Checklist →]
Frequently asked
Why do AI workflows fail differently than traditional software?
AI workflows have a third failure mode beyond working or throwing errors: they continue running and returning responses while producing subtly or catastrophically wrong outputs. This silent degradation lacks stack traces or obvious error signals, making it harder to detect than traditional software failures.
What is quality drift in production AI systems?
Quality drift occurs when AI workflow outputs gradually degrade in accuracy or relevance while the system continues operating normally. Teams often discover it only when customers complain or infrastructure bills spike, because monitoring during the pilot phase wasn't instrumented to catch silent degradation.
What metrics should I monitor for production AI workflows?
The post addresses metrics that actually matter for catching silent failures, cost overruns, and quality drift. It covers designing alert thresholds that trigger on real problems and how to document monitoring in ways that satisfy security and compliance teams.
Building AI into real operations is what we do.
Start a conversation